Subscribe

RSS Feed (xml)

Powered By

Skin Design:
Free Blogger Skins

Powered by Blogger


Showing posts with label KARNAUGH MAPPING 4C8. Show all posts

Thursday, September 4, 2008

Introduction KARNAUGH MAPPING


Why learn about Karnaugh maps? The Karnaugh map, like Boolean algebra, is a simplification tool applicable to digital logic. See the "Toxic waste incinerator" in the Boolean algebra chapter for an example of Boolean simplification of digital logic. The Karnaugh Map will simplify logic faster and more easily in most cases.

Boolean simplification is actually faster than the Karnaugh map for a task involving two or fewer Boolean variables. It is still quite usable at three variables, but a bit slower. At four input variables, Boolean algebra becomes tedious. Karnaugh maps are both faster and easier. Karnaugh maps work well for up to six input variables, are usable for up to eight variables. For more than six to eight variables, simplification should be by CAD (computer automated design).

In theory any of the three methods will work. However, as a practical matter, the above guidelines work well. We would not normally resort to computer automation to simplify a three input logic block. We could sooner solve the problem with pencil and paper. However, if we had seven of these problems to solve, say for a BCD (Binary Coded Decimal) to seven segment decoder, we might want to automate the process. A BCD to seven segment decoder generates the logic signals to drive a seven segment LED (light emitting diode) display.

Examples of computer automated design languages for simplification of logic are PALASM, ABEL, CUPL, Verilog, and VHDL. These programs accept a hardware descriptor language input file which is based on Boolean equations and produce an output file describing a reduced (or simplified) Boolean solution. We will not require such tools in this chapter. Let's move on to Venn diagrams as an introduction to Karnaugh maps.

Venn diagrams and sets KARNAUGH MAPPING


Mathematicians use Venn diagrams to show the logical relationships of sets (collections of objects) to one another. Perhaps you have already seen Venn diagrams in your algebra or other mathematics studies. If you have, you may remember overlapping circles and the union and intersection of sets. We will review the overlapping circles of the Venn diagram. We will adopt the terms OR and AND instead of union and intersection since that is the terminology used in digital electronics.

The Venn diagram bridges the Boolean algebra from a previous chapter to the Karnaugh Map. We will relate what you already know about Boolean algebra to Venn diagrams, then transition to Karnaugh maps.

A set is a collection of objects out of a universe as shown below. The members of the set are the objects contained within the set. The members of the set usually have something in common; though, this is not a requirement. Out of the universe of real numbers, for example, the set of all positive integers {1,2,3...} is a set. The set {3,4,5} is an example of a smaller set, or subset of the set of all positive integers. Another example is the set of all males out of the universe of college students. Can you think of some more examples of sets?


Above left, we have a Venn diagram showing the set A in the circle within the universe U, the rectangular area. If everything inside the circle is A, then anything outside of the circle is not A. Thus, above center, we label the rectangular area outside of the circle A as A-not instead of U. We show B and B-not in a similar manner.

What happens if both A and B are contained within the same universe? We show four possibilities.


Let's take a closer look at each of the the four possibilities as shown above.


The first example shows that set A and set B have nothing in common according to the Venn diagram. There is no overlap between the A and B circular hatched regions. For example, suppose that sets A and B contain the following members:

set A = {1,2,3,4}
set B = {5,6,7,8}

None of the members of set A are contained within set B, nor are any of the members of B contained within A. Thus, there is no overlap of the circles.


In the second example in the above Venn diagram, Set A is totally contained within set B How can we explain this situation? Suppose that sets A and B contain the following members:

set A = {1,2}

set B = {1,2,3,4,5,6,7,8}

All members of set A are also members of set B. Therefore, set A is a subset of Set B. Since all members of set A are members of set B, set A is drawn fully within the boundary of set B.

There is a fifth case, not shown, with the four examples. Hint: it is similar to the last (fourth) example. Draw a Venn diagram for this fifth case.


The third example above shows perfect overlap between set A and set B. It looks like both sets contain the same identical members. Suppose that sets A and B contain the following:

set A = {1,2,3,4} set B = {1,2,3,4}


Therefore,


Set A = Set B

Sets And B are identically equal because they both have the same identical members. The A and B regions within the corresponding Venn diagram above overlap completely. If there is any doubt about what the above patterns represent, refer to any figure above or below to be sure of what the circular regions looked like before they were overlapped.


The fourth example above shows that there is something in common between set A and set B in the overlapping region. For example, we arbitrarily select the following sets to illustrate our point:

set A = {1,2,3,4}
set B = {3,4,5,6}

Set A and Set B both have the elements 3 and 4 in common These elements are the reason for the overlap in the center common to A and B. We need to take a closer look at this situation

Boolean Relationships on Venn Diagrams KARNAUGH MAPPING


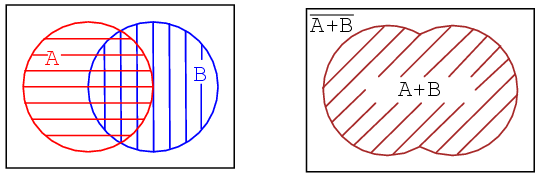
The fourth example has A partially overlapping B. Though, we will first look at the whole of all hatched area below, then later only the overlapping region. Let's assign some Boolean expressions to the regions above as shown below. Below left there is a red horizontal hatched area for A. There is a blue vertical hatched area for B.


If we look at the whole area of both, regardless of the hatch style, the sum total of all hatched areas, we get the illustration above right which corresponds to the inclusive OR function of A, B. The Boolean expression is A+B. This is shown by the 45o hatched area. Anything outside of the hatched area corresponds to (A+B)-not as shown above. Let's move on to next part of the fourth example

The other way of looking at a Venn diagram with overlapping circles is to look at just the part common to both A and B, the double hatched area below left. The Boolean expression for this common area corresponding to the AND function is AB as shown below right. Note that everything outside of double hatched AB is AB-not.


Note that some of the members of A, above, are members of (AB)'. Some of the members of B are members of (AB)'. But, none of the members of (AB)' are within the doubly hatched area AB.


We have repeated the second example above left. Your fifth example, which you previously sketched, is provided above right for comparison. Later we will find the occasional element, or group of elements, totally contained within another group in a Karnaugh map.


Next, we show the development of a Boolean expression involving a complemented variable below.


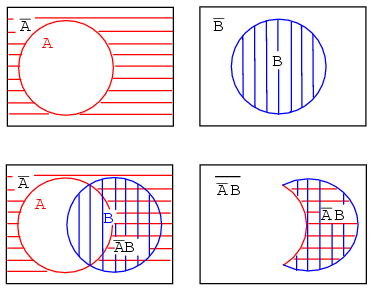
Example: (above)


Show a Venn diagram for A'B (A-not AND B).


Solution:


Starting above top left we have red horizontal shaded A' (A-not), then, top right, B. Next, lower left, we form the AND function A'B by overlapping the two previous regions. Most people would use this as the answer to the example posed. However, only the double hatched A'B is shown far right for clarity. The expression A'B is the region where both A' and B overlap. The clear region outside of A'B is (A'B)', which was not part of the posed example.

Let's try something similar with the Boolean OR function.


Example:

Find B'+A


Solution:


Above right we start out with B which is complemented to B'. Finally we overlay A on top of B'. Since we are interested in forming the OR function, we will be looking for all hatched area regardless of hatch style. Thus, A+B' is all hatched area above right. It is shown as a single hatch region below left for clarity.


Example:


Find (A+B')'


Solution:


The green 45o A+B' hatched area was the result of the previous example. Moving on to a to,(A+B')' ,the present example, above left, let us find the complement of A+B', which is the white clear area above left corresponding to (A+B')'. Note that we have repeated, at right, the AB' double hatched result from a previous example for comparison to our result. The regions corresponding to (A+B')' and AB' above left and right respectively are identical. This can be proven with DeMorgan's theorem and double negation.

This brings up a point. Venn diagrams don't actually prove anything. Boolean algebra is needed for formal proofs. However, Venn diagrams can be used for verification and visualization. We have verified and visualized DeMorgan's theorem with a Venn diagram.


Example:


What does the Boolean expression A'+B' look like on a Venn Diagram?


Solution: above figure


Start out with red horizontal hatched A' and blue vertical hatched B' above. Superimpose the diagrams as shown. We can still see the A' red horizontal hatch superimposed on the other hatch. It also fills in what used to be part of the B (B-true) circle, but only that part of the B open circle not common to the A open circle. If we only look at the B' blue vertical hatch, it fills that part of the open A circle not common to B. Any region with any hatch at all, regardless of type, corresponds to A'+B'. That is, everything but the open white space in the center.


Example:


What does the Boolean expression (A'+B')' look like on a Venn Diagram?


Solution: above figure, lower left


Looking at the white open space in the center, it is everything NOT in the previous solution of A'+B', which is (A'+B')'.


Example:


Show that (A'+B') = AB


Solution: below figure, lower left


We previously showed on the above right diagram that the white open region is (A'+B')'. On an earlier example we showed a doubly hatched region at the intersection (overlay) of AB. This is the left and middle figures repeated here. Comparing the two Venn diagrams, we see that this open region , (A'+B')', is the same as the doubly hatched region AB (A AND B). We can also prove that (A'+B')'=AB by DeMorgan's theorem and double negation as shown above.


We show a three variable Venn diagram above with regions A (red horizontal), B (blue vertical), and, C (green 45o). In the very center note that all three regions overlap representing Boolean expression ABC. There is also a larger petal shaped region where A and B overlap corresponding to Boolean expression AB. In a similar manner A and C overlap producing Boolean expression AC. And B and C overlap producing Boolean expression BC.

Looking at the size of regions described by AND expressions above, we see that region size varies with the number of variables in the associated AND expression.

  • A, 1-variable is a large circular region.
  • AB, 2-variable is a smaller petal shaped region.
  • ABC, 3-variable is the smallest region.
  • The more variables in the AND term, the smaller the region.

Making a Venn diagram look like a Karnaugh map


Starting with circle A in a rectangular A' universe in figure (a) below, we morph a Venn diagram into almost a Karnaugh map.


We expand circle A at (b) and (c), conform to the rectangular A' universe at (d), and change A to a rectangle at (e). Anything left outside of A is A' . We assign a rectangle to A' at (f). Also, we do not use shading in Karnaugh maps. What we have so far resembles a 1-variable Karnaugh map, but is of little utility. We need multiple variables.


Figure (a) above is the same as the previous Venn diagram showing A and A' above except that the labels A and A' are above the diagram instead of inside the respective regions. Imagine that we have go through a process similar to figures (a-f) to get a "square Venn diagram" for B and B' as we show in middle figure (b). We will now superimpose the diagrams in Figures (a) and (b) to get the result at (c), just like we have been doing for Venn diagrams. The reason we do this is so that we may observe that which may be common to two overlapping regions-- say where A overlaps B. The lower right cell in figure (c) corresponds to AB where A overlaps B.


We don't waste time drawing a Karnaugh map like (c) above, sketching a simplified version as above left instead. The column of two cells under A' is understood to be associated with A', and the heading A is associated with the column of cells under it. The row headed by B' is associated with the cells to the right of it. In a similar manner B is associated with the cells to the right of it. For the sake of simplicity, we do not delineate the various regions as clearly as with Venn diagrams.

The Karnaugh map above right is an alternate form used in most texts. The names of the variables are listed next to the diagonal line. The A above the diagonal indicates that the variable A (and A') is assigned to the columns. The 0 is a substitute for A', and the 1 substitutes for A. The B below the diagonal is associated with the rows: 0 for B', and 1 for B


Example:


Mark the cell corresponding to the Boolean expression AB in the Karnaugh map above with a 1


Solution:


Shade or circle the region corresponding to A. Then, shade or enclose the region corresponding to B. The overlap of the two regions is AB. Place a 1 in this cell. We do not necessarily enclose the A and B regions as at above left.


We develop a 3-variable Karnaugh map above, starting with Venn diagram like regions. The universe (inside the black rectangle) is split into two narrow narrow rectangular regions for A' and A. The variables B' and B divide the universe into two square regions. C occupies a square region in the middle of the rectangle, with C' split into two vertical rectangles on each side of the C square.

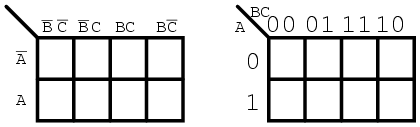
In the final figure, we superimpose all three variables, attempting to clearly label the various regions. The regions are less obvious without color printing, more obvious when compared to the other three figures. This 3-variable K-Map (Karnaugh map) has 23 = 8 cells, the small squares within the map. Each individual cell is uniquely identified by the three Boolean Variables (A, B, C). For example, ABC' uniquely selects the lower right most cell(*), A'B'C' selects the upper left most cell (x).


We don't normally label the Karnaugh map as shown above left. Though this figure clearly shows map coverage by single boolean variables of a 4-cell region. Karnaugh maps are labeled like the illustration at right. Each cell is still uniquely identified by a 3-variable product term, a Boolean AND expression. Take, for example, ABC' following the A row across to the right and the BC' column down, both intersecting at the lower right cell ABC'. See (*) above figure.


The above two different forms of a 3-variable Karnaugh map are equivalent, and is the final form that it takes. The version at right is a bit easier to use, since we do not have to write down so many boolean alphabetic headers and complement bars, just 1s and 0s Use the form of map on the right and look for the the one at left in some texts. The column headers on the left B'C', B'C, BC, BC' are equivalent to 00, 01, 11, 10 on the right. The row headers A, A' are equivalent to 0, 1 on the right map.

Karnaugh maps, truth tables, and Boolean expressions KARNAUGH MAPPING


Maurice Karnaugh, a telecommunications engineer, developed the Karnaugh map at Bell Labs in 1953 while designing digital logic based telephone switching circuits.

Now that we have developed the Karnaugh map with the aid of Venn diagrams, let's put it to use. Karnaugh maps reduce logic functions more quickly and easily compared to Boolean algebra. By reduce we mean simplify, reducing the number of gates and inputs. We like to simplify logic to a lowest cost form to save costs by elimination of components. We define lowest cost as being the lowest number of gates with the lowest number of inputs per gate.

Given a choice, most students do logic simplification with Karnaugh maps rather than Boolean algebra once they learn this tool.
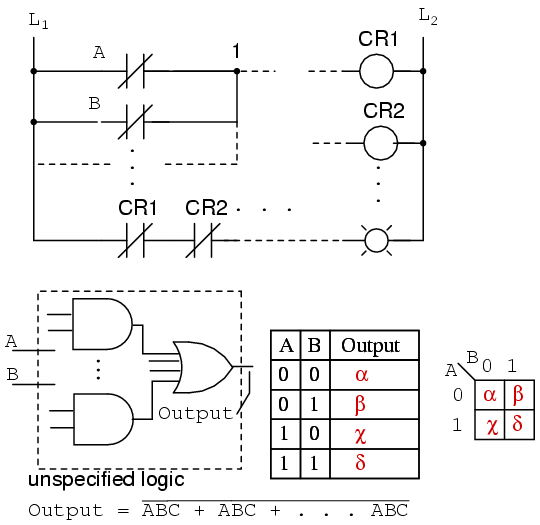

We show five individual items above, which are just different ways of representing the same thing: an arbitrary 2-input digital logic function. First is relay ladder logic, then logic gates, a truth table, a Karnaugh map, and a Boolean equation. The point is that any of these are equivalent. Two inputs A and B can take on values of either 0 or 1, high or low, open or closed, True or False, as the case may be. There are 22 = 4 combinations of inputs producing an output. This is applicable to all five examples.

These four outputs may be observed on a lamp in the relay ladder logic, on a logic probe on the gate diagram. These outputs may be recorded in the truth table, or in the Karnaugh map. Look at the Karnaugh map as being a rearranged truth table. The Output of the Boolean equation may be computed by the laws of Boolean algebra and transfered to the truth table or Karnaugh map. Which of the five equivalent logic descriptions should we use? The one which is most useful for the task to be accomplished.
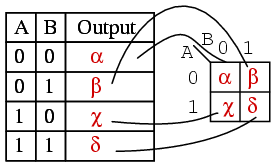


The outputs of a truth table correspond on a one-to-one basis to Karnaugh map entries. Starting at the top of the truth table, the A=0, B=0 inputs produce an output α. Note that this same output α is found in the Karnaugh map at the A=0, B=0 cell address, upper left corner of K-map where the A=0 row and B=0 column intersect. The other truth table outputs β, χ, δ from inputs AB=01, 10, 11 are found at corresponding K-map locations.

Below, we show the adjacent 2-cell regions in the 2-variable K-map with the aid of previous rectangular Venn diagram like Boolean regions.
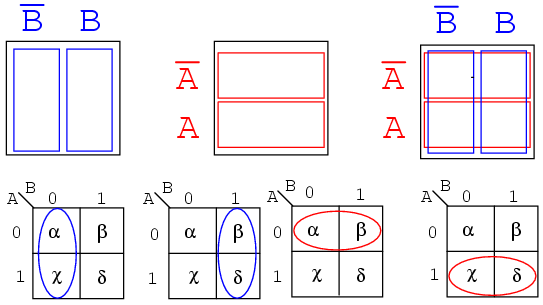


Cells α and χ are adjacent in the K-map as ellipses in the left most K-map below. Referring to the previous truth table, this is not the case. There is another truth table entry (β) between them. Which brings us to the whole point of the organizing the K-map into a square array, cells with any Boolean variables in common need to be close to one another so as to present a pattern that jumps out at us. For cells α and χ they have the Boolean variable B' in common. We know this because B=0 (same as B') for the column above cells α and χ. Compare this to the square Venn diagram above the K-map.

A similar line of reasoning shows that β and δ have Boolean B (B=1) in common. Then, α and β have Boolean A' (A=0) in common. Finally, χ and δ have Boolean A (A=1) in common. Compare the last two maps to the middle square Venn diagram.

To summarize, we are looking for commonality of Boolean variables among cells. The Karnaugh map is organized so that we may see that commonality. Let's try some examples.


Example:


Transfer the contents of the truth table to the Karnaugh map above.
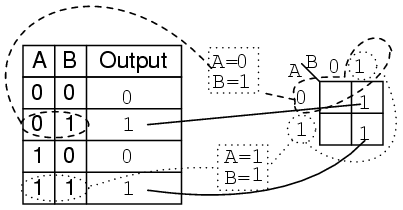


Solution:


The truth table contains two 1s. the K- map must have both of them. locate the first 1 in the 2nd row of the truth table above.

  • note the truth table AB address
  • locate the cell in the K-map having the same address
  • place a 1 in that cell
Repeat the process for the 1 in the last line of the truth table.

Example:


For the Karnaugh map in the above problem, write the Boolean expression. Solution is below.


Solution:


Look for adjacent cells, that is, above or to the side of a cell. Diagonal cells are not adjacent. Adjacent cells will have one or more Boolean variables in common.

  • Group (circle) the two 1s in the column
  • Find the variable(s) top and/or side which are the same for the group, Write this as the Boolean result. It is B in our case.
  • Ignore variable(s) which are not the same for a cell group. In our case A varies, is both 1 and 0, ignore Boolean A.
  • Ignore any variable not associated with cells containing 1s. B' has no ones under it. Ignore B'
  • Result Out = B

This might be easier to see by comparing to the Venn diagrams to the right, specifically the B column.


Example:


Write the Boolean expression for the Karnaugh map below.


Solution: (above)

  • Group (circle) the two 1's in the row
  • Find the variable(s) which are the same for the group, Out = A'

Example:


For the Truth table below, transfer the outputs to the Karnaugh, then write the Boolean expression for the result.


Solution:


Transfer the 1s from the locations in the Truth table to the corresponding locations in the K-map.

  • Group (circle) the two 1's in the column under B=1
  • Group (circle) the two 1's in the row right of A=1
  • Write product term for first group = B
  • Write product term for second group = A
  • Write Sum-Of-Products of above two terms Output = A+B
The solution of the K-map in the middle is the simplest or lowest cost solution. A less desirable solution is at far right. After grouping the two 1s, we make the mistake of forming a group of 1-cell. The reason that this is not desirable is that:
  • The single cell has a product term of AB'
  • The corresponding solution is Output = AB' + B
  • This is not the simplest solution
The way to pick up this single 1 is to form a group of two with the 1 to the right of it as shown in the lower line of the middle K-map, even though this 1 has already been included in the column group (B). We are allowed to re-use cells in order to form larger groups. In fact, it is desirable because it leads to a simpler result.

We need to point out that either of the above solutions, Output or Wrong Output, are logically correct. Both circuits yield the same output. It is a matter of the former circuit being the lowest cost solution.


Example:


Fill in the Karnaugh map for the Boolean expression below, then write the Boolean expression for the result.


Solution: (above)


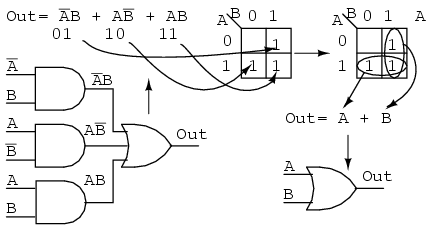
The Boolean expression has three product terms. There will be a 1 entered for each product term. Though, in general, the number of 1s per product term varies with the number of variables in the product term compared to the size of the K-map. The product term is the address of the cell where the 1 is entered. The first product term, A'B, corresponds to the 01 cell in the map. A 1 is entered in this cell. The other two P-terms are entered for a total of three 1s

Next, proceed with grouping and extracting the simplified result as in the previous truth table problem.


Example:


Simplify the logic diagram below.


Solution: (Figure below)

  • Write the Boolean expression for the original logic diagram as shown below
  • Transfer the product terms to the Karnaugh map
  • Form groups of cells as in previous examples
  • Write Boolean expression for groups as in previous examples
  • Draw simplified logic diagram


Example:


Simplify the logic diagram below.


Solution:

  • Write the Boolean expression for the original logic diagram shown above
  • Transfer the product terms to the Karnaugh map.
  • It is not possible to form groups.
  • No simplification is possible; leave it as it is.

No logic simplification is possible for the above diagram. This sometimes happens. Neither the methods of Karnaugh maps nor Boolean algebra can simplify this logic further. We show an Exclusive-OR schematic symbol above; however, this is not a logical simplification. It just makes a schematic diagram look nicer. Since it is not possible to simplify the Exclusive-OR logic and it is widely used, it is provided by manufacturers as a basic integrated circuit (7486).

Logic simplification with Karnaugh maps


The logic simplification examples that we have done so could have been performed with Boolean algebra about as quickly. Real world logic simplification problems call for larger Karnaugh maps so that we may do serious work. We will work some contrived examples in this section, leaving most of the real world applications for the Combinatorial Logic chapter. By contrived, we mean examples which illustrate techniques. This approach will develop the tools we need to transition to the more complex applications in the Combinatorial Logic chapter.

We show our previously developed Karnaugh map. We will use the form on the right


Note the sequence of numbers across the top of the map. It is not in binary sequence which would be 00, 01, 10, 11. It is 00, 01, 11 10, which is Gray code sequence. Gray code sequence only changes one binary bit as we go from one number to the next in the sequence, unlike binary. That means that adjacent cells will only vary by one bit, or Boolean variable. This is what we need to organize the outputs of a logic function so that we may view commonality. Moreover, the column and row headings must be in Gray code order, or the map will not work as a Karnaugh map. Cells sharing common Boolean variables would no longer be adjacent, nor show visual patterns. Adjacent cells vary by only one bit because a Gray code sequence varies by only one bit.

If we sketch our own Karnaugh maps, we need to generate Gray code for any size map that we may use. This is how we generate Gray code of any size.


Note that the Gray code sequence, above right, only varies by one bit as we go down the list, or bottom to top up the list. This property of Gray code is often useful in digital electronics in general. In particular, it is applicable to Karnaugh maps.

Let us move on to some examples of simplification with 3-variable Karnaugh maps. We show how to map the product terms of the unsimplified logic to the K-map. We illustrate how to identify groups of adjacent cells which leads to a Sum-of-Products simplification of the digital logic.


Above we, place the 1's in the K-map for each of the product terms, identify a group of two, then write a p-term (product term) for the sole group as our simplified result.


Mapping the four product terms above yields a group of four covered by Boolean A'


Mapping the four p-terms yields a group of four, which is covered by one variable C.


After mapping the six p-terms above, identify the upper group of four, pick up the lower two cells as a group of four by sharing the two with two more from the other group. Covering these two with a group of four gives a simpler result. Since there are two groups, there will be two p-terms in the Sum-of-Products result A'+B


The two product terms above form one group of two and simplifies to BC


Mapping the four p-terms yields a single group of four, which is B


Mapping the four p-terms above yields a group of four. Visualize the group of four by rolling up the ends of the map to form a cylinder, then the cells are adjacent. We normally mark the group of four as above left. Out of the variables A, B, C, there is a common variable: C'. C' is a 0 over all four cells. Final result is C'.


The six cells above from the unsimplified equation can be organized into two groups of four. These two groups should give us two p-terms in our simplified result of A' + C'.


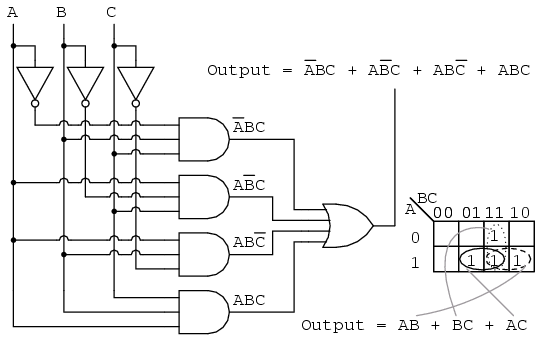
Below, we revisit the Toxic Waste Incinerator from the Boolean algebra chapter. See Boolean algebra chapter for details on this example. We will simplify the logic using a Karnaugh map.


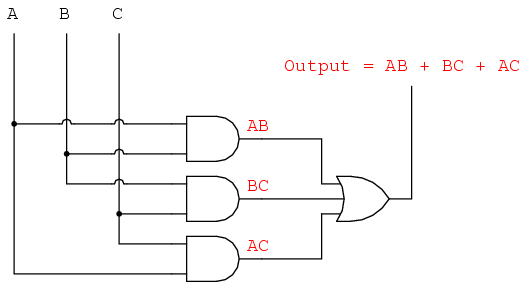
The Boolean equation for the output has four product terms. Map four 1's corresponding to the p-terms. Forming groups of cells, we have three groups of two. There will be three p-terms in the simplified result, one for each group. See "Toxic Waste Incinerator", Boolean algebra chapter for a gate diagram of the result, which is reproduced below.


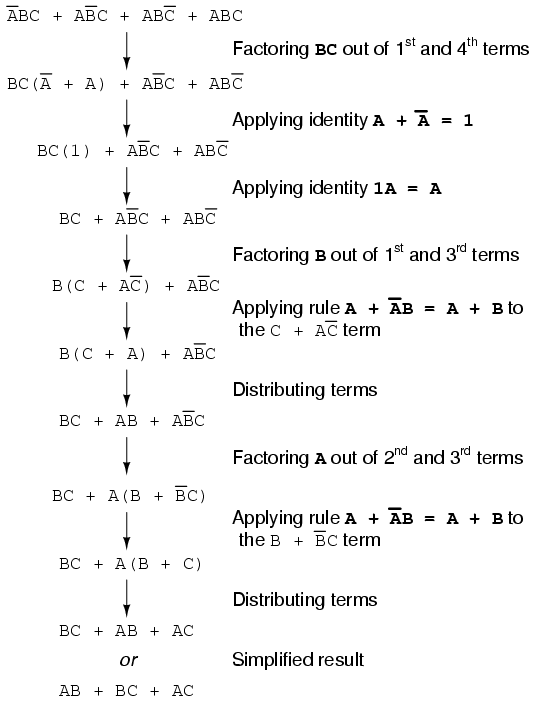
Below we repeat the Boolean algebra simplification of Toxic waste incinerator for comparison.


Below we repeat the Toxic waste incinerator Karnaugh map solution for comparison to the above Boolean algebra simplification. This case illustrates why the Karnaugh map is widely used for logic simplification.


The Karnaugh map method looks easier than the previous page of boolean algebra.

Larger 4-variable Karnaugh maps


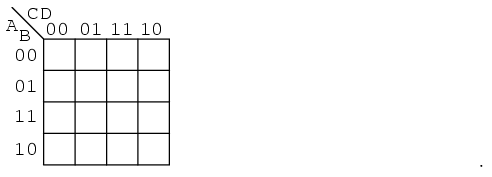
Knowing how to generate Gray code should allow us to build larger maps. Actually, all we need to do is look at the left to right sequence across the top of the 3-variable map, and copy it down the left side of the 4-variable map. See below.


The following four variable Karnaugh maps illustrate reduction of Boolean expressions too tedious for Boolean algebra. Reductions could be done with Boolean algebra. However, the Karnaugh map is faster and easier, especially if there are many logic reductions to do.


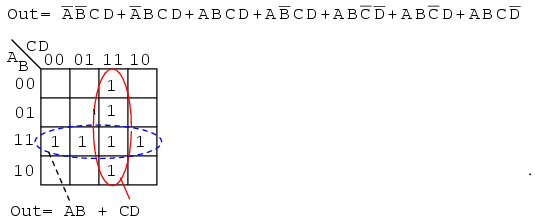
The above Boolean expression has seven product terms. They are mapped top to bottom and left to right on the K-map above. For example, the first P-term A'B'CD is first row 3rd cell, corresponding to map location A=0, B=0, C=1, D=1. The other product terms are placed in a similar manner. Encircling the largest groups possible, two groups of four are shown above. The dashed horizontal group corresponds the the simplified product term AB. The vertical group corresponds to Boolean CD. Since there are two groups, there will be two product terms in the Sum-Of-Products result of Out=AB+CD.


Fold up the corners of the map below like it is a napkin to make the four cells physically adjacent.

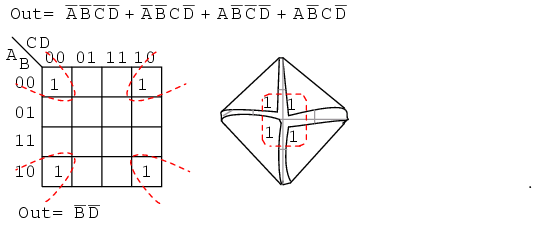
The four cells above are a group of four because they all have the Boolean variables B' and D' in common. In other words, B=0 for the four cells, and D=0 for the four cells. The other variables (A, B) are 0 in some cases, 1 in other cases with respect to the four corner cells. Thus, these variables (A, B) are not involved with this group of four. This single group comes out of the map as one product term for the simplified result: Out=B'C'


For the K-map below, roll the top and bottom edges into a cylinder forming eight adjacent cells.


The above group of eight has one Boolean variable in common: B=0. Therefore, the one group of eight is covered by one p-term: B'. The original eight term Boolean expression simplifies to Out=B'


The Boolean expression below has nine p-terms, three of which have three Booleans instead of four. The difference is that while four Boolean variable product terms cover one cell, the three Boolean p-terms cover a pair of cells each.


The six product terms of four Boolean variables map in the usual manner above as single cells. The three Boolean variable terms (three each) map as cell pairs, which is shown above. Note that we are mapping p-terms into the K-map, not pulling them out at this point.

For the simplification, we form two groups of eight. Cells in the corners are shared with both groups. This is fine. In fact, this leads to a better solution than forming a group of eight and a group of four without sharing any cells. Final Solution is Out=B'+D'


Below we map the unsimplified Boolean expression to the Karnaugh map.


Above, three of the cells form into a groups of two cells. A fourth cell cannot be combined with anything, which often happens in "real world" problems. In this case, the Boolean p-term ABCD is unchanged in the simplification process. Result: Out= B'C'D'+A'B'D'+ABCD

Often times there is more than one minimum cost solution to a simplification problem. Such is the case illustrated below.


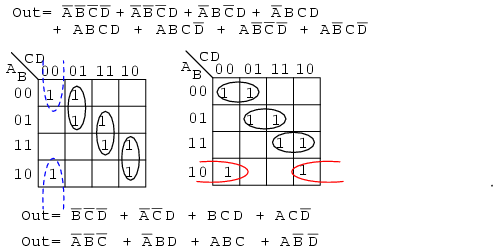
Both results above have four product terms of three Boolean variable each. Both are equally valid minimal cost solutions. The difference in the final solution is due to how the cells are grouped as shown above. A minimal cost solution is a valid logic design with the minimum number of gates with the minimum number of inputs.


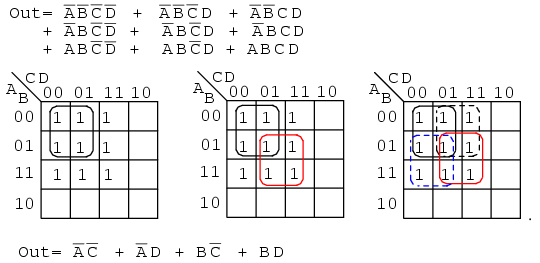
Below we map the unsimplified Boolean equation as usual and form a group of four as a first simplification step. It may not be obvious how to pick up the remaining cells.


Pick up three more cells in a group of four, center above. There are still two cells remaining. the minimal cost method to pick up those is to group them with neighboring cells as groups of four as at above right.

On a cautionary note, do not attempt to form groups of three. Groupings must be powers of 2, that is, 1, 2, 4, 8 ...


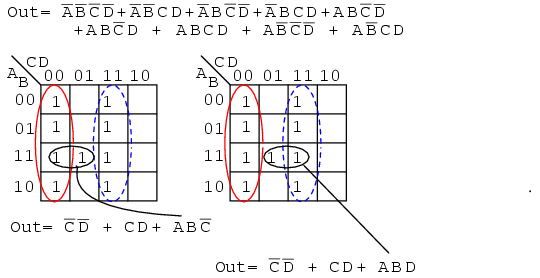
Below we have another example of two possible minimal cost solutions. Start by forming a couple of groups of four after mapping the cells.


The two solutions depend on whether the single remaining cell is grouped with the first or the second group of four as a group of two cells. That cell either comes out as either ABC' or ABD, your choice. Either way, this cell is covered by either Boolean product term. Final results are shown above.


Below we have an example of a simplification using the Karnaugh map at left or Boolean algebra at right. Plot C' on the map as the area of all cells covered by address C=0, the 8-cells on the left of the map. Then, plot the single ABCD cell. That single cell forms a group of 2-cell as shown, which simplifies to P-term ABD, for an end result of Out = C' + ABD.


This (above) is a rare example of a four variable problem that can be reduced with Boolean algebra without a lot of work, assuming that you remember the theorems.

Recent Posts